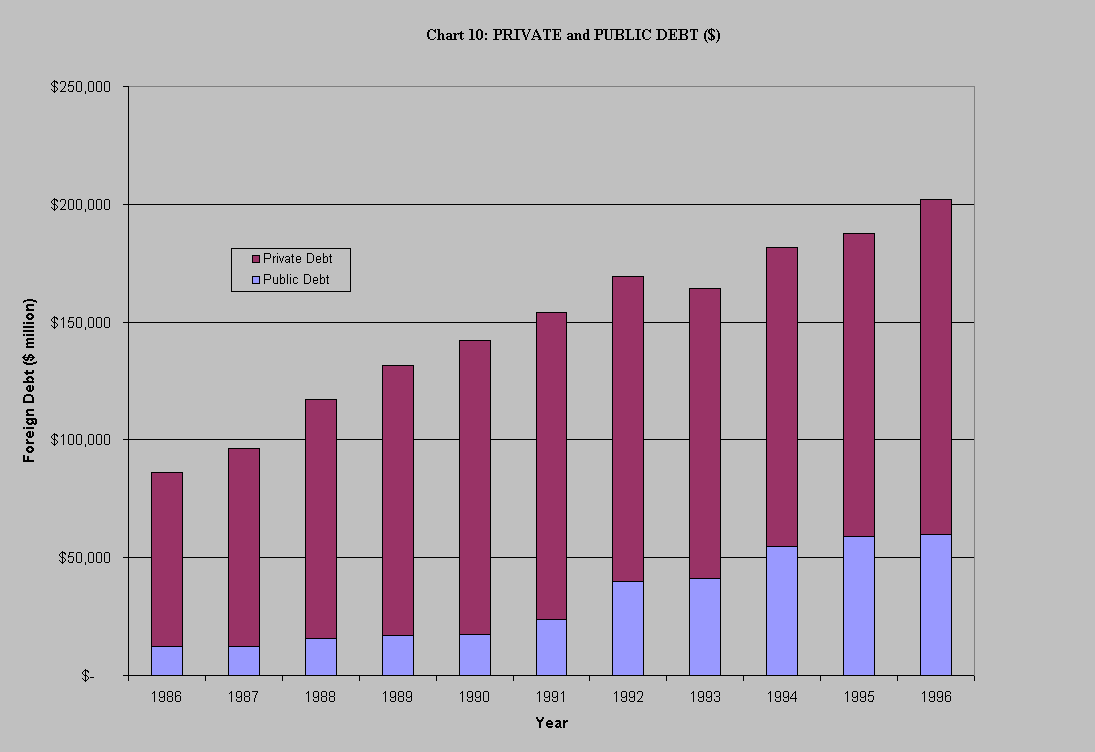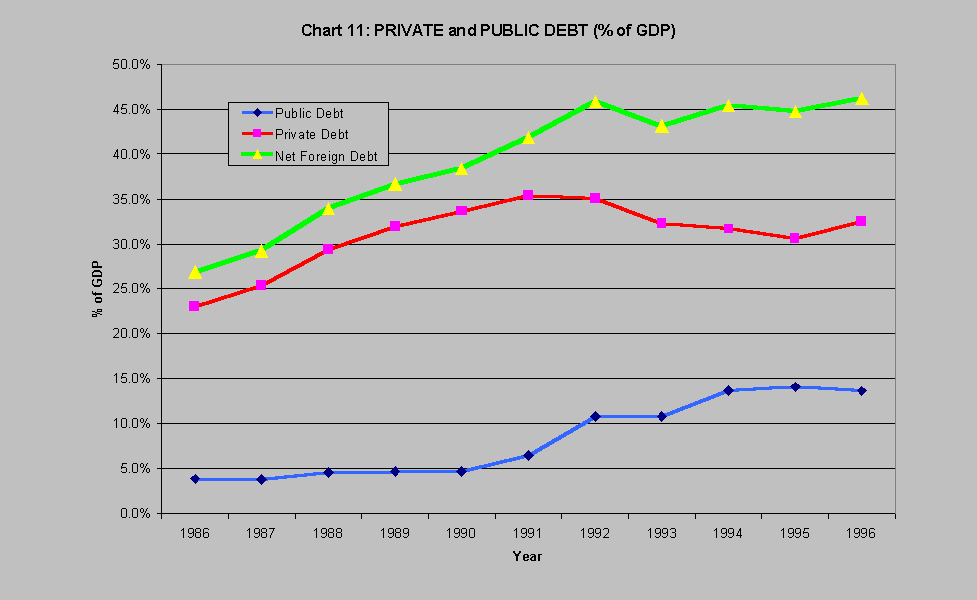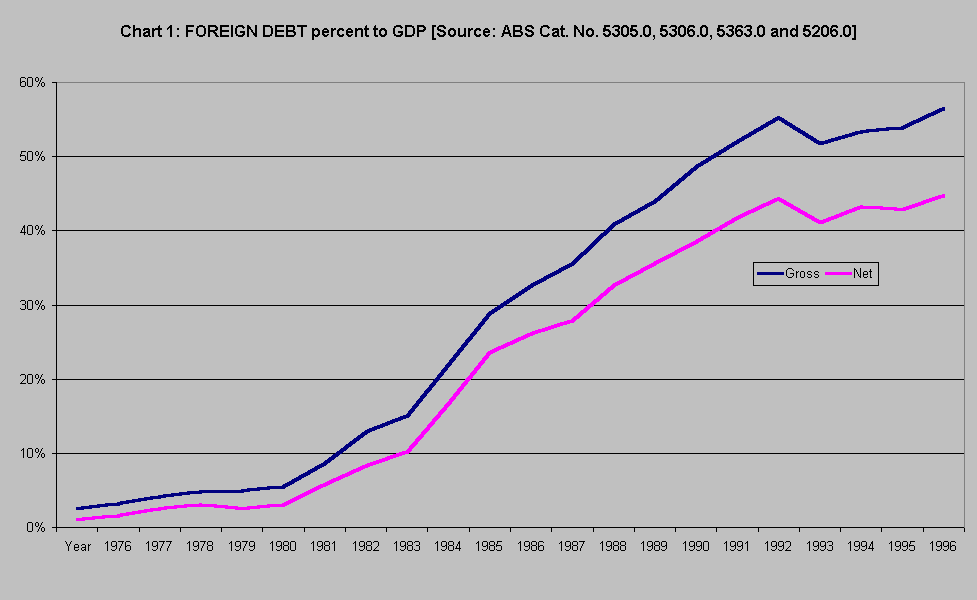
Australia's foreign debt has increased sharply since the beginning of the 1980s and in net terms stands at $202 billion or around 45% of the GDP (as at Jun 1997). This worries many economists (and politicians like Paul Keating who made the 'banana republic' statement), notably Dr Fitzgerald, whose famous report in 1993 claimed that Australia faces economic disaster and the risk of plunging into a foreign debt crisis (Fitzgerald 1993). However, opinions vary on the extent to which this magnitude of foreign debt posses a problem to Australia. So, what contributed to the rise in foreign debt? The most important factor is the large and persistent deficits on its current account with the rest of the world (see Chart 2 overleaf). Since 1980, the CAD has not been much lower than 4% of GDP. This compares with an average deficit of 2¼% of GDP in the 1960s and 1970s (Fraser 1990a). So, does the CAD then pose a problem? Formal Governor of RBA, B.W. Fraser (1990b, pg. 9), argued that a young nation like Australia with limited savings but many investment opportunities, should "draw on overseas savings to exploit those opportunities". According to him, a current account deficit was seen as the normal state of affairs.
Before we examine the relationship between the size of the CAD and the magnitude of the foreign debt, let us look at its definition. According to Professor Pitchford (1989), the current account balance measures the excess of exports over imports of goods and services, plus net income from international transactions, which mainly consists of net receipts of interest and dividends from aboard. When the current account is in deficit, the agents in an economy are spending more than they earn, including net interest payments. Excess spending must then be financed either by borrowing or by running down assets (the change in foreign net assets is measured by the capital account). A CAD thus means an increase in the net level of foreign indebtedness by the private or public sector.
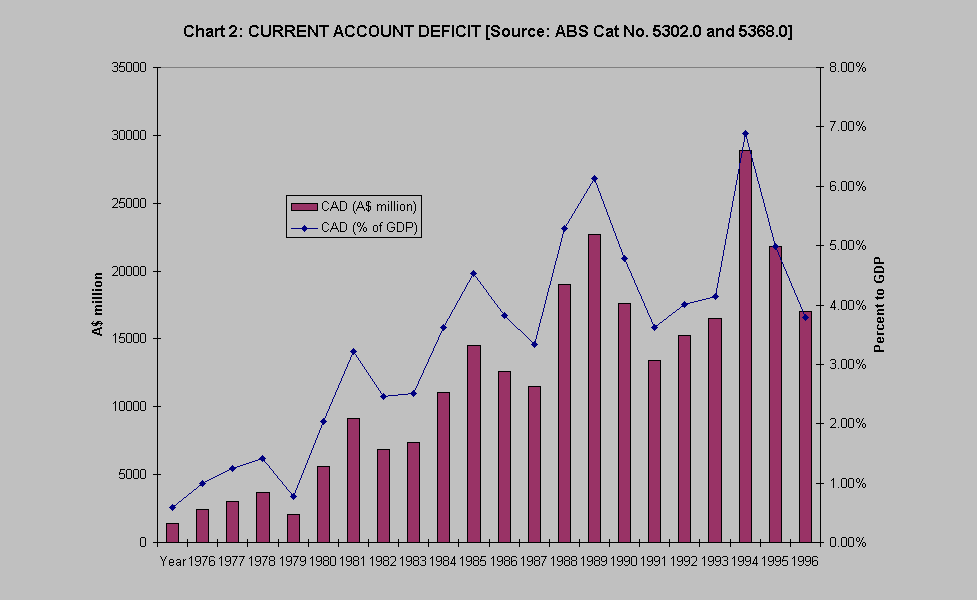
Chart 3 overleaf shows the slight correlation between CAD and the amount of foreign debt. This reaffirms the theory that the CAD being financed by external savings (also reflected as a capital surplus due to inflow of foreign funds into Australia) is the main cause for the escalating foreign debt.
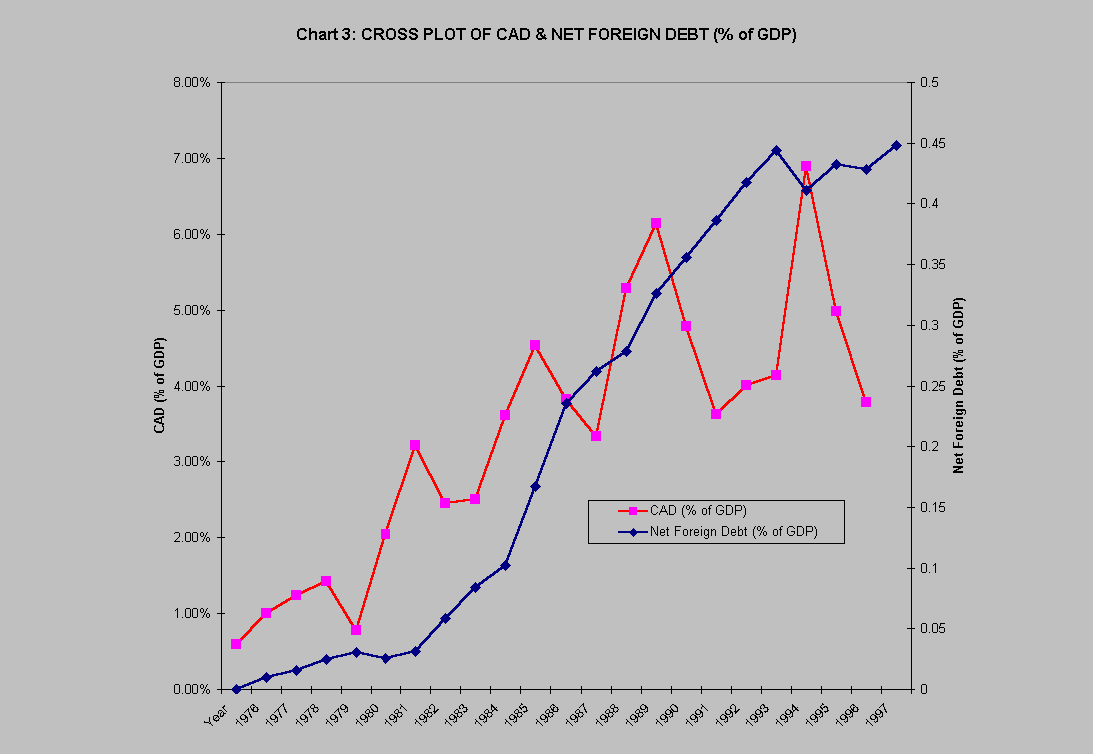
Note also in Chart 3, that the CAD (as % of GDP) is usually higher when the economy grows strongly and falls when the economy slows.
From the point of view of the foreign debt, Clark (1997) identified four main factors that attributed to its dramatic rise:
