Today, the largest shares of exports are still from the minerals and agricultural sectors. This is because Australia has a comparative advantage in these activities. The Heckscher-Ohlin theory can give us some insight into why this is so.
In this essay, we will define the Heckscher-Ohlin theory, and discuss its implications for the pattern of trade to be expected for Australia given her factor endowment. This will be compared with the current trade pattern to determine its goodness of fit. In addition, we will be highlighting whether Australia's trade is primarily inter-industry or intra-industry trade, and whether any other trade theories could help to better explain her trading pattern.
2. THE HECKSCHER--OHLIN THEORY
In the basic Ricardian model, comparative advantage could only be determined by differences in labour productivity between countries, as this classical economic model assumes that labour is the only factor of production. In the real world, however, differences in the countries' endowment of resources also play an important part in explaining the difference in relative commodity prices, thus comparative advantage between them.
One of the most influential theories in international economics, the Heckscher-Ohlin (H-O) theory professes that international trade is largely driven by differences in countries' endowment of their resources, given a set of strict assumptions.
Consider a capital abundance country like Japan, and the land abundance Australia, both producing steel (capital intensive good) and wool (land intensive). If we illustrate the different relative factor endowments using the Edgeworth Box (in figure 1), we can see that the maximum amount of steel Japan can produce (at S4 ) exceeds the maximum amount Australia can produce (at S3) . Australia, having abundance of land, can produce more wool than Japan when both produce at maximum capacity (higher isoquant WA, 3 compared with WJ, 2).
Now representing this factor endowment differences using two PPFs, we have, at autarky, Japan consuming steel and wool at SJap and WJap respectively, while Australia consume at SAus and WAus (see figure 2). At these consumption mixes, both nations could achieve a level of common community indifference curve at CI0 (assuming both nations have identical demand structure.
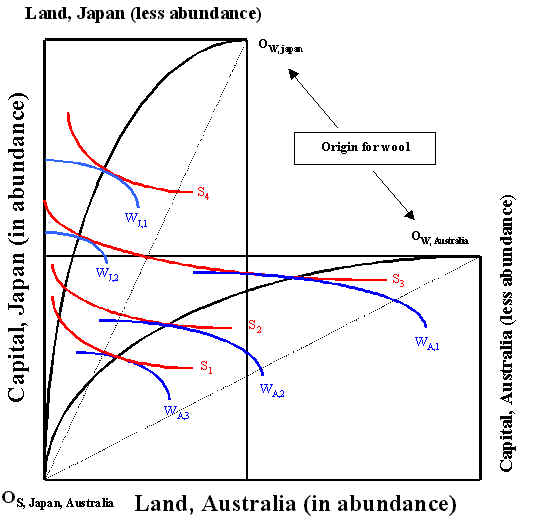
Figure 1: Edgeworth Box diagram for differences in factor abundance
Credit: Figure 1 from Bloch (1998)
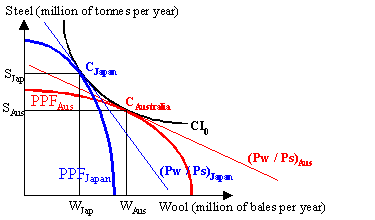
Figure 2: PPF diagrams for differences in factor abundance (in autarky)
Credit: Figure 2 from Bloch (1998)
Suppose now both countries open for trade (at international terms of trade), both countries could consume at CAustralia, Japan which lies outside their respective PPFs (see figure 3). In order to achieve this, Japan will have to export S0S1 of steel in exchange for W2W1 bales of imported wool from Australia, while Australia exports W0W1 bales of wools and imports S2S1 tonnes of steel from Japan. This consumption enables both nations to achieve a higher community indifference curve at CI1.
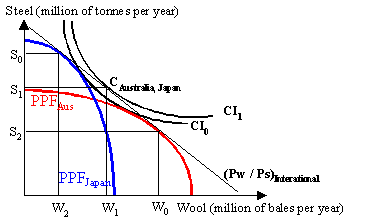
Figure 3: Trade when countries have identical tastes
Credit: Figure 1 from Bloch (1998)
Thus, we have shown that a capital abundance country like Japan would export capital intensive good like steel and import wool, while the land abundance Australia would export land intensive wool in exchange for imported steel. This is the major conclusion for the H-O theorem.
3. HECKSCHER-OHLIN THEOREM FOR AUSTRALIA'S PATTERN OF TRADE?
The Heckscher-Ohlin theorem states that a country will have a comparative advantage in those goods and services that are produced with factors of production which it has in relative abundance. Thus, a country will export the commodity that uses relatively intensively its relatively abundant factor of production, and import goods that uses relatively its relatively scarce factor of production.
To establish what Australia has in relative abundance is the first step in determining what it has a comparative advantage in. Casual observation by Lewis et al (1998, pg. 21) suggests, among other things, that it has a relative abundance of land, energy, mineral deposits, highly educated labour, natural beauty and fine weather. Thus, Australia can offer a comparative advantage in industries such as agriculture, mining, education services and tourism. It also suggests that Australia has a comparative disadvantage in basic manufacturing, as it is relatively scarce of low-skilled labour.
According to Promfret (1995), for the natural-resource-rich, lightly populated Australia, its key determinant of comparative advantage is its relative factor endowment with the rest of the world. This is because Australia is "very richly endowed with agricultural land and mineral and energy resources per worker" (ibid, pg. 30) coupled with a relatively highly skilled workforce. Promfret summarised these factors graphically with a Leamer triangle shown overleaf. Compared with other economies in examination, Australia appears high in the NWD space of the Leamer triangle, indicating that it is "very abundantly endowed with natural resources per worker and has well above average stocks of produced capital per worker, relative to the rest of the world" (ibid, pg. 32). This fits Lewis's observation, and would also expect Australia to be a net exporter of raw materials, food, fibre and processed primary products, and a net importer of basic manufactures and services.
N.A.
Figure 4: Relative endowments of natural resources, labour and produced capital, various economies, 1991
Source: Adapted from Leamer (1987) using data from the World Bank (1993).
It should be noted that comparative advantage could change over time in response to changes in its own or other economies' resources (Lewis et al 1998, Promfret 1995). For example, discovery of new fuel or mineral deposits in Australia, or a depletion of the natural resources elsewhere in the world would see Australia exporting more energy raw materials. On the same note, there is a scope for Australia to develop new industries or manufacturing processes to replace the declining industries such as textiles, clothing and footwear.
4. Australia's pattern of international trade
As mentioned in the introduction, Australia's export has shifted away from its historical dominance in primary products (given its relative abundance of natural resources per worker). With the opening of mineral market opportunities in Japan, the mining sector began to flourish. Together with the rise in price of energy raw materials in the world market during the first and second oil crisis, the fuels and minerals sector began to catch up with, and finally overtook the primary products sector around mid-1980s (Promfret 1995). There is also an increasing share in non-primary products exports. We can see these changes, over the years, in figure 5 below.
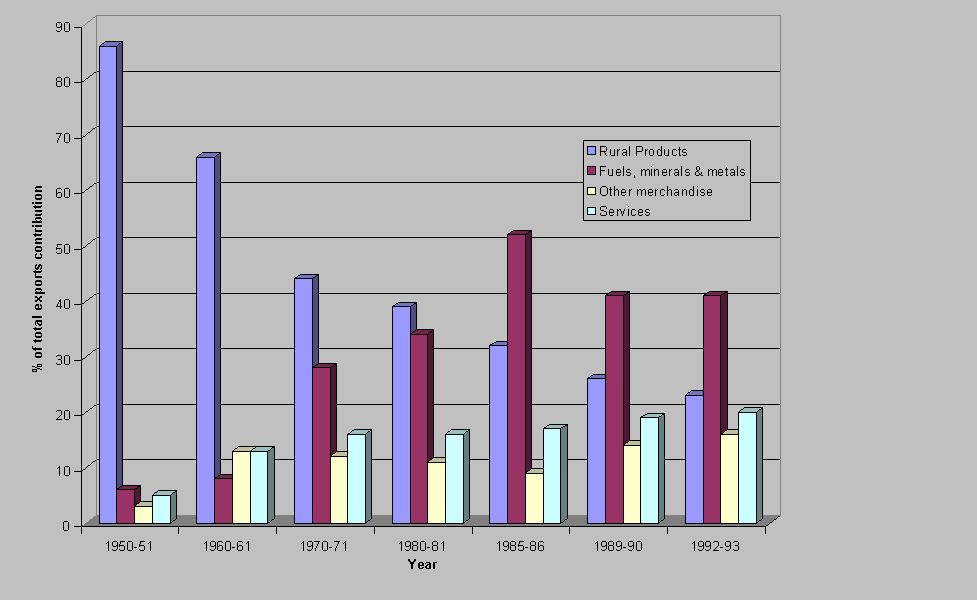
Figure 5: Contribution to exports of goods and services by sector in Australia from 1950-51 to 1992-93
Source: Table 1.1 (Promfret 1995, pg. 33)
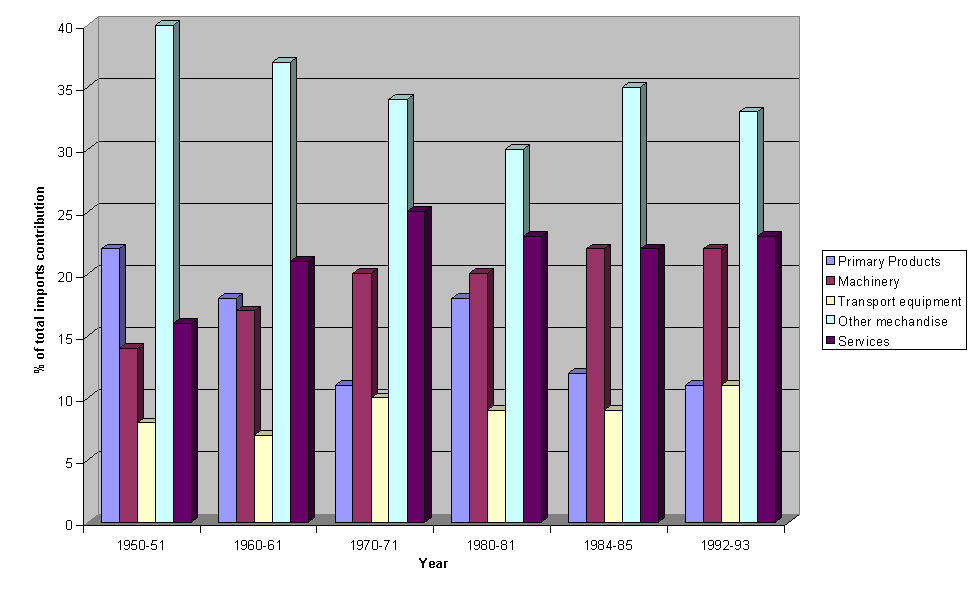
The import composition of Australia's trade has been considerably more stable than export composition, and that "manufactures dominate imports and primary products are of minor significance" (Promfret 1995, pg. 34). The composition of Australia's imports, over the years, is shown in figure 6 overleaf.
Figure 6: Composition of Australia's imports of goods and services, 1950-51 to 1992-93
Source: Table 1.2 (Promfret 1995, pg. 34)
According to the index of trade specialisation in Promfret (1995, pg. 35), reproduced here as figure 7 overleaf, the primary products exhibits a fluctuation around positive two-thirds (with no trend). For manufactures, this indicator has been highly negative but declining over the decades (less negative) suggesting that "Australia is becoming more involved in intra-industry trade in manufactures and gaining competitiveness in some niche markets" (Ibid, pg. 34). As for the service sector, the indicator is slightly negative, especially in more recent years. Promfret (1995) attributes this to the more rapid rise of service exports (notably tourism and education services) over imports.
MERCHANDISE TRADE
Australia's merchandise trade increased by 8% to A$168.2 billion in 1997, giving a trade surplus of A$1.3 billion, up from a deficit of A$1.4 billion the year before.
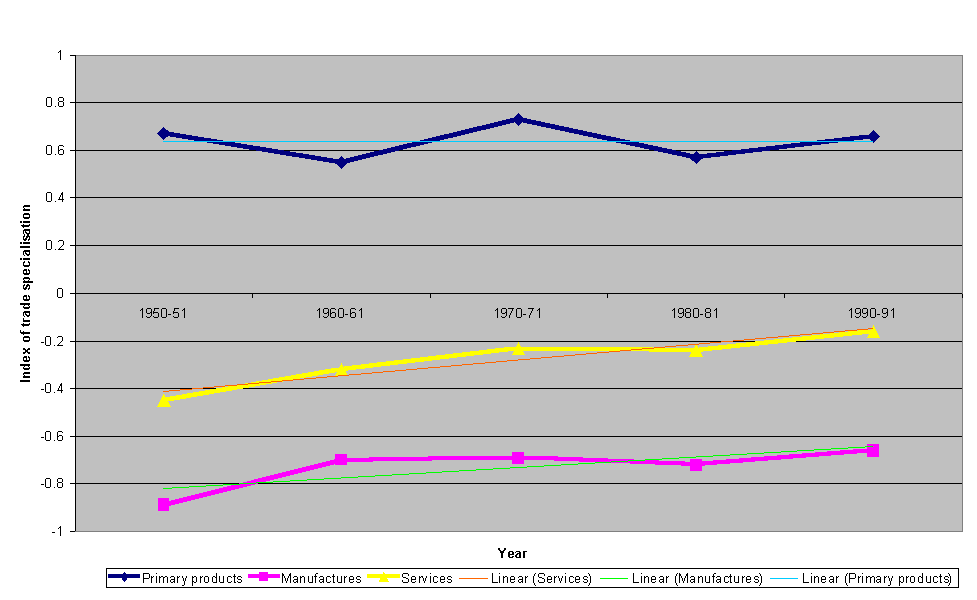
Figure 7: Index of trade specialisation, 1950-51 to 1990-91 (Current value of net exports / exports plus imports)
Source: Table 1.3 (Promfret 1995, pg. 35)
Figure 8 below show the merchandise trade in Australia from 1987 to 1997. Note that it was the first trade surplus since 1993.
N.A.
Figure 8: Australia's merchandise trade from 1987 to 1997 (in current price)
According to the Department of Foreign Affairs and Trade (1998a), merchandise exports were valued at A$84.8 billion in 1997, up 10% from 1996. In 1997, merchandise exports comprised 59% primary products, 10% Simply transformed manufactures (STMs), 23% Elaborately transformed manufactures (ETMs) and 8% other exports.
ETMs' share of total merchandise exports has increased from 19% in 1992 to 23% in 1997. Primary products' share has decreased from 62% to 59% over the same period. Manufactures exports have increased by 11% annually since 1992, largely due to strong growth in the export of ETMs. This increases the share of total merchandise exports from 28% to 33% in 1997. Figure 9 below illustrates the broad composition of exports in the above-mentioned four categories for 1992 and 1997.
N.A.
Figure 9: Broad composition of merchandise exports in 1992 and 1997
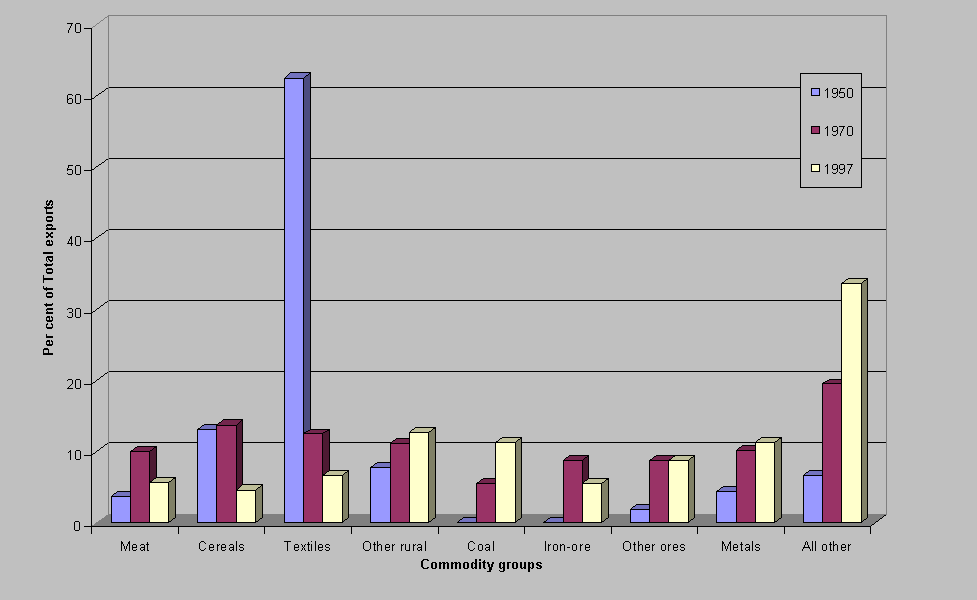
A better illustration with more specific commodity groups for the year 1960, 1980 and 1997, are shown in figure 10 and 11.
Figure 10: Exports of goods by commodity groups
Source: ABS catalogue no. 5368.0 (various issues)
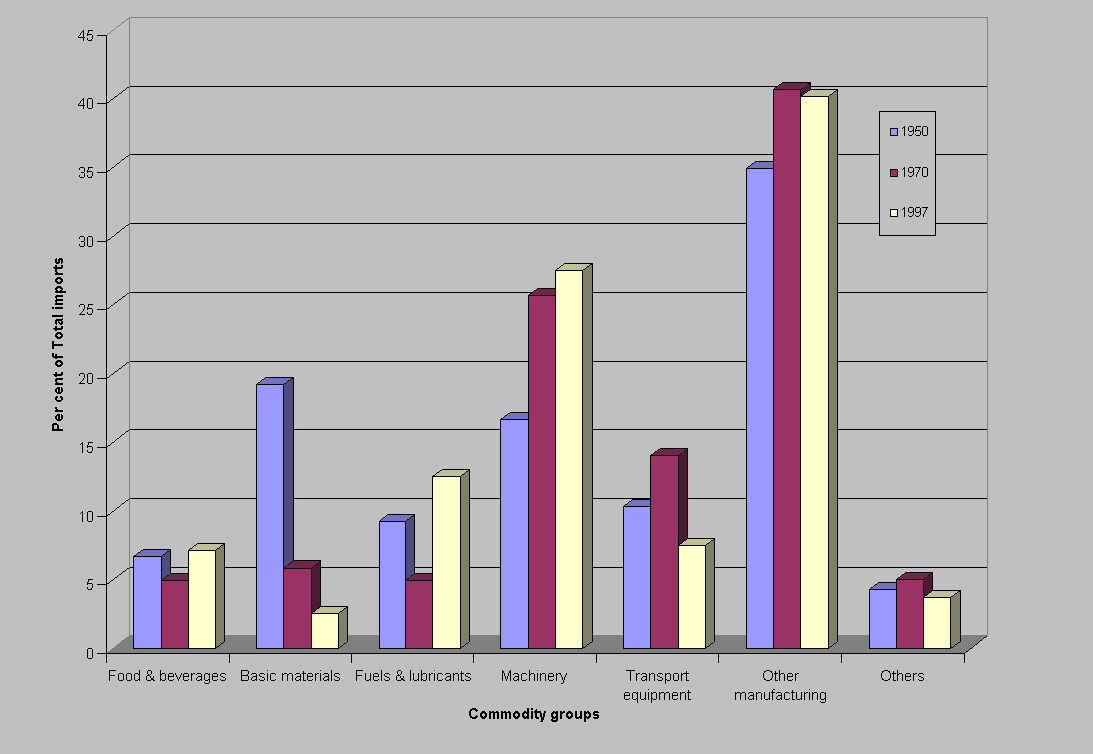
Figure 11: Imports of goods by commodity groups
Source: ABS catalogue no. 5368.0 (various issues)
Merchandise imports increased by 6% to A$83.4 billion in 1997. It have always been dominated by ETMs. In 1997, merchandise imports comprised 13% primary products, 10% STMs, 76% ETMs and 1% other imports. These compositions has changed little from 1992 when imports were made up of 13% primary products, 11% STMs, 73% ETMs and 2% other imports as shown below: