CURTIN UNIVERSITY OF TECHNOLOGY
CURTIN BUSINESS SCHOOL
School of Economics and Finance
ECONOMETRICS 313
SEMESTER1, 1998
ASSIGNMENT 4
Prepared For : Dr Garry MacDonald
Prepared By : Chow Tai Wei, David
Student No. : 977438B
INTRODUCTION
Given the quarterly data for the 3-months interest rate (R3M), 10-years interest rate (R10Y), real GDP figures and the money supply (M1/P) for the period from 1st quarter 1953 to the 4th quarter 1988 (144 observations), we are to analyse them with our knowledge of time-series data and their properties.
OBJECTIVES
In this assignment, we are required to perform unit root tests on all 4 data sets and the cointegration test (ie. to determine whether there is evidence of cointegration between variables).
METHOD OF TESTS
Two econometrics programs -- SHAZAM and PCGIVE would be utilised to perform the above tests.
We use SHAZAM to determine the significant number of lags order required, perform the full augmented Dicky-Fuller test (in which SHAZAM output reports the test statistics together with the 10% asymptotic critical values of the respective tests). From the SHAZAM output, we could determine the stationarity of the respective data set (by testing for unit root), the presence of deterministic trends and drifts of each data set with and without first-order differencing.
PCGIVE will be utilised to plot the original and differenced data, and their correlograms. From these observations, we could roughly determine the stationarity of the given data set. We would also use PCGIVE to run OLS regression on their I(1) models to further determine the significance of unit roots, trends and drifts as part of the sequential test.
Data plot and Correlogram on all 4 variables
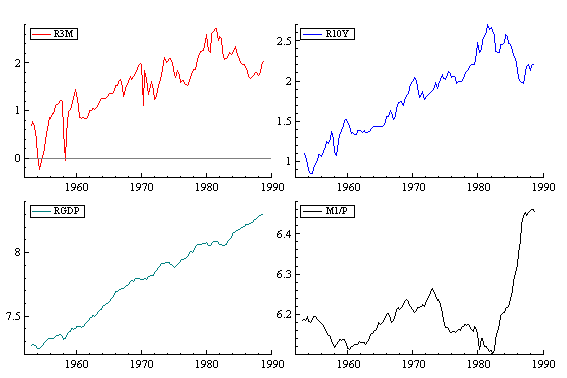
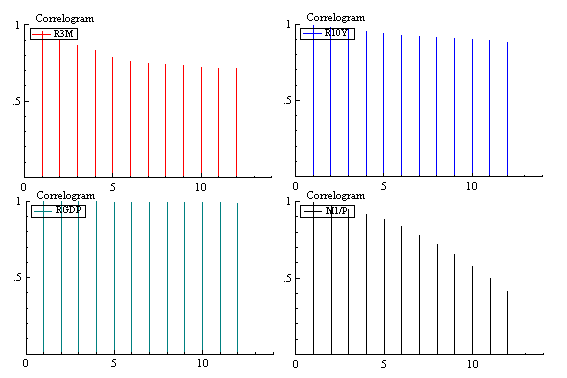
The following are graphs of the 4 sets of raw data plotted against time, and their correlograms. Looking at the graphs, it seems that only M1/P is stationary while the other three, having upward trend and thus seems non-stationary. When we study their correlograms, again it seems that only M1/P is stationary.


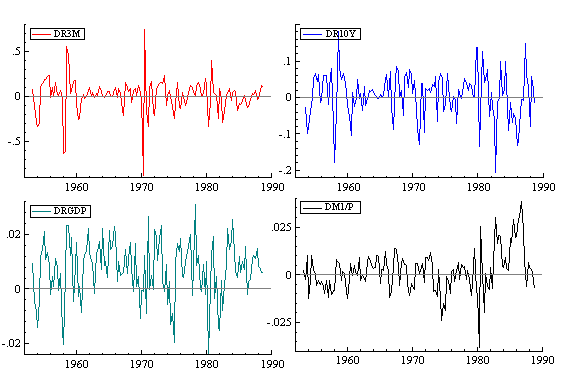
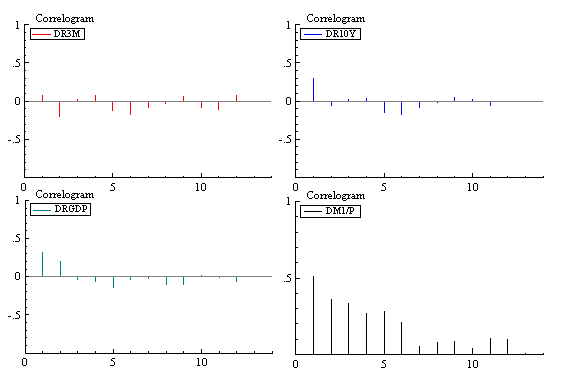
The following graphs plot the first differenced data against time and their correlograms. It seems that taking the first-order differencing on the respective variables can eliminate the problem of non-stationarity.


Dicky-Fuller Unit Root Tests Procedures
![]() .
.
![]() with H0: (a ,r ) = (0,1). If do not reject, it reaffirms that series is
non-stationary with no drift (determined with greater power when the restriction is
imposed).
with H0: (a ,r ) = (0,1). If do not reject, it reaffirms that series is
non-stationary with no drift (determined with greater power when the restriction is
imposed).
.
Cointegration test
An approach to testing for cointegration (or evidence of a long run relationship between non-stationary variables) is to construct test statistics from the residuals of a cointegrating regression. With M time series, ie. Yt1, Yt2,…, YtM, each of which is I(1) (integrated of order one), two forms of cointegrating regression models are:
Model (A) is no-trend and model (B) is with-trend. The choice of regressand is
arbitrary and different choices can be considered. A test for no cointegration is given by
a test for a unit root in the estimated residuals ![]() . The augmented Dicky-Fuller regression equation is:
. The augmented Dicky-Fuller regression equation is:
![]()
Test statistics are the z-test, and the t-ratio test for ![]() . If a
test statistic is smaller than the critical value, then there is no evidence for
cointegration.
. If a
test statistic is smaller than the critical value, then there is no evidence for
cointegration.
As we want to test for cointegration between long-term and short-term interest rates (R3M and R10Y, respectively) with real GDP and money supply (M1/P), we would first ensure that all variables to be tested are integrated in the same order (ie. I(1) in this case), and would test for cointegration twice as follows:
i) Cointegration test for R3M, RGDP and M1/P
From the SHAZAM output, using cointegrating regression model (A), we can test
for H0: ![]() against H1:
against H1: ![]() on the ADF eqn.
on the ADF eqn. ![]() .
.
Since t* > tcrit, we reject H0
(ie. stationary on ![]() ) and conclude that there
is evidence of cointegration between R3M, RGDP and M1/P on the no-trend cointegrating
regression model (A).
) and conclude that there
is evidence of cointegration between R3M, RGDP and M1/P on the no-trend cointegrating
regression model (A).
Using cointegrating regression model (B), we can test for H0: ![]() against
against
H1: ![]() on the ADF eqn.
on the ADF eqn. ![]() .
.
Since t* < tcrit, we do not reject H0 and conclude that there are no evidence of cointegration between R3M, RGDP and M1/P on the with-trend cointegrating regression model (B).
ii) Cointegration test for R10Y, RGDP and M1/P
From the SHAZAM output, with both cointegrating regression model (A) and (B), we
test for H0: ![]() against H1:
against H1: ![]() on
on ![]() .
.
Since all test statistics < tcrit, we do not reject H0 and conclude that R10Y, RGDP and M1/P variables are not cointegrated.
[Click Here for the Dicky-Fuller Unit Root Tests Result ]
Return to Assignments for Semester 1, 1998